

Conversations & Business Intelligence
Business Intelligence reads the conversations your deployment has already stored and derives analytics from them. It classifies each conversation into a topic, measures whether conversations resolved, reports adoption by Role and tool, and flags recurring questions the assistant could not answer. It is offline analysis over conversation history — it runs against stored sessions, not against live chat, and produces nothing until you run a classification job.
You reach it from the admin portal at Conversations & BI. Reading the page requires the bi:read
permission; the actions that write — running a classification, changing a knowledge gap’s status,
editing the taxonomy — require bi:write. The performance charts at the bottom of the page also read
session statistics, which fall under monitoring:read.
The page controls
Section titled “The page controls”Three controls sit in the toolbar above the panels:
- Assistant selector — scopes every panel to one Assistant, or All Assistants, which is the default.
- Date range — the window every query runs over. It defaults to the last 30 days.
- Classify — starts a topic-classification job. The button only appears if you hold
bi:write.
Next to them, a Taxonomy button opens the taxonomy sub-page described below.
Running a classification
Section titled “Running a classification”Classify dispatches a background job that reads the sessions in scope that have not yet been analyzed, sends each conversation through a classification graph, and writes one analytics row per session. When a job is running, a status banner reads Classification running… N sessions processed; the page polls that status every few seconds and refreshes the panels when it finishes. If a job is already running, a new trigger is ignored — one classification runs at a time.
Classification is what populates every panel on this page. A conversation contributes to the topic, resolution, adoption, and tool numbers only after it has been classified. New sessions do not appear until the next classification job covers them, whether you trigger it with Classify or leave it to the scheduled run.
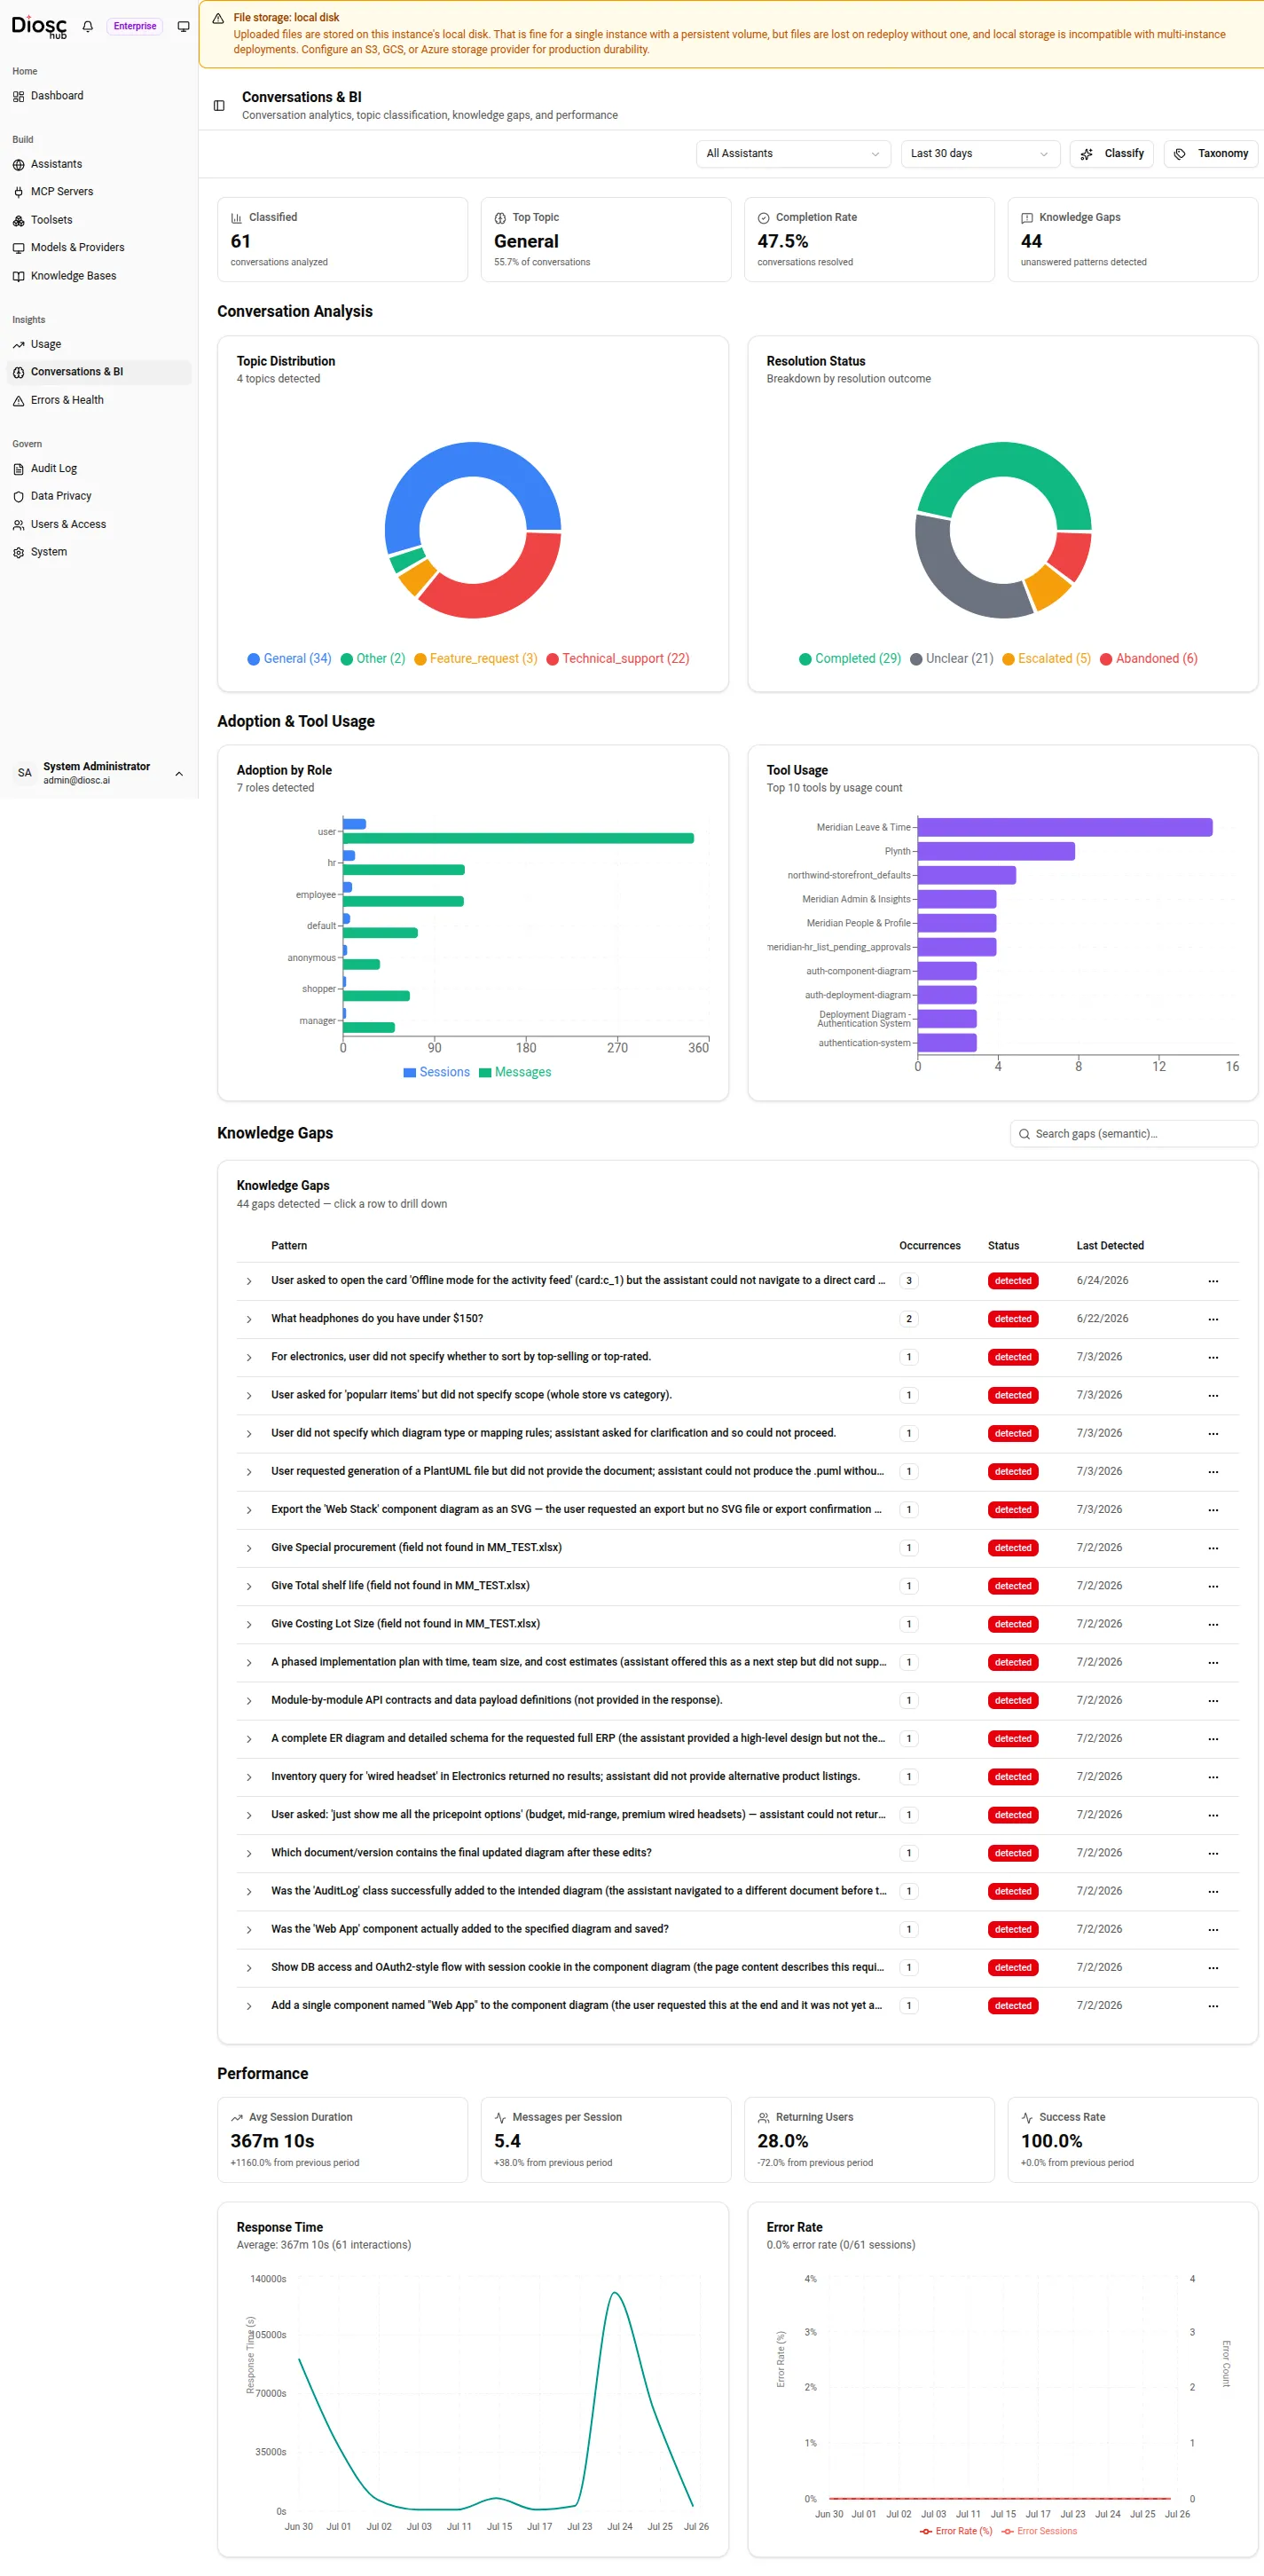 The overview dashboard: the stat tiles summarize the window at a glance, and the Conversation Analysis
charts below them break the same data down by topic and by resolution status.
The overview dashboard: the stat tiles summarize the window at a glance, and the Conversation Analysis
charts below them break the same data down by topic and by resolution status.
The panels
Section titled “The panels”Overview stats
Section titled “Overview stats”Four tiles summarize the current scope and window:
- Classified — the number of conversations analyzed (the sum of every topic’s count).
- Top Topic — the single most common topic and its share of conversations.
- Completion Rate — the share of conversations whose resolution status is
completed. - Knowledge Gaps — the count of unanswered-question patterns detected.
Topic distribution and resolution
Section titled “Topic distribution and resolution”Under Conversation Analysis, two charts sit side by side. The topic-distribution chart shows how classified conversations split across your topic categories. The resolution chart shows the breakdown of resolution status across those same conversations.
Adoption and tool insights
Section titled “Adoption and tool insights”Under Adoption & Tool Usage, the adoption chart reports usage by Role — including average messages per session for each Role — and the tool-insights chart reports which MCP tools the conversations exercised, derived by unnesting each session’s recorded tool list.
Knowledge Gaps
Section titled “Knowledge Gaps”A knowledge gap is a recurring question the assistant could not answer from its knowledge or tools.
During classification, each conversation’s detected gaps are matched against existing ones by semantic
(vector) similarity: a genuinely new gap is recorded, and a similar one has its occurrence count
incremented. A gap starts as a candidate and is promoted to detected once it recurs enough times,
which keeps one-off questions out of the default view.
The Knowledge Gaps table lists the detected patterns, ordered by occurrence count so the most frequent sit first. The search box above it runs a semantic search over the gaps — it ranks by vector similarity, and falls back to a case-insensitive substring match when embeddings are unavailable. Click a row to drill into privacy-safe aggregates for that gap: resolution, topic, Role, and tool breakdowns plus average message count, computed from server-side join keys.
With bi:write, each row carries a menu to move the gap through its lifecycle — acknowledged,
addressed, or dismissed. The gap DTO exposes only aggregate magnitudes (how many sessions, how
many distinct users); it never returns the raw session or user IDs behind a gap.
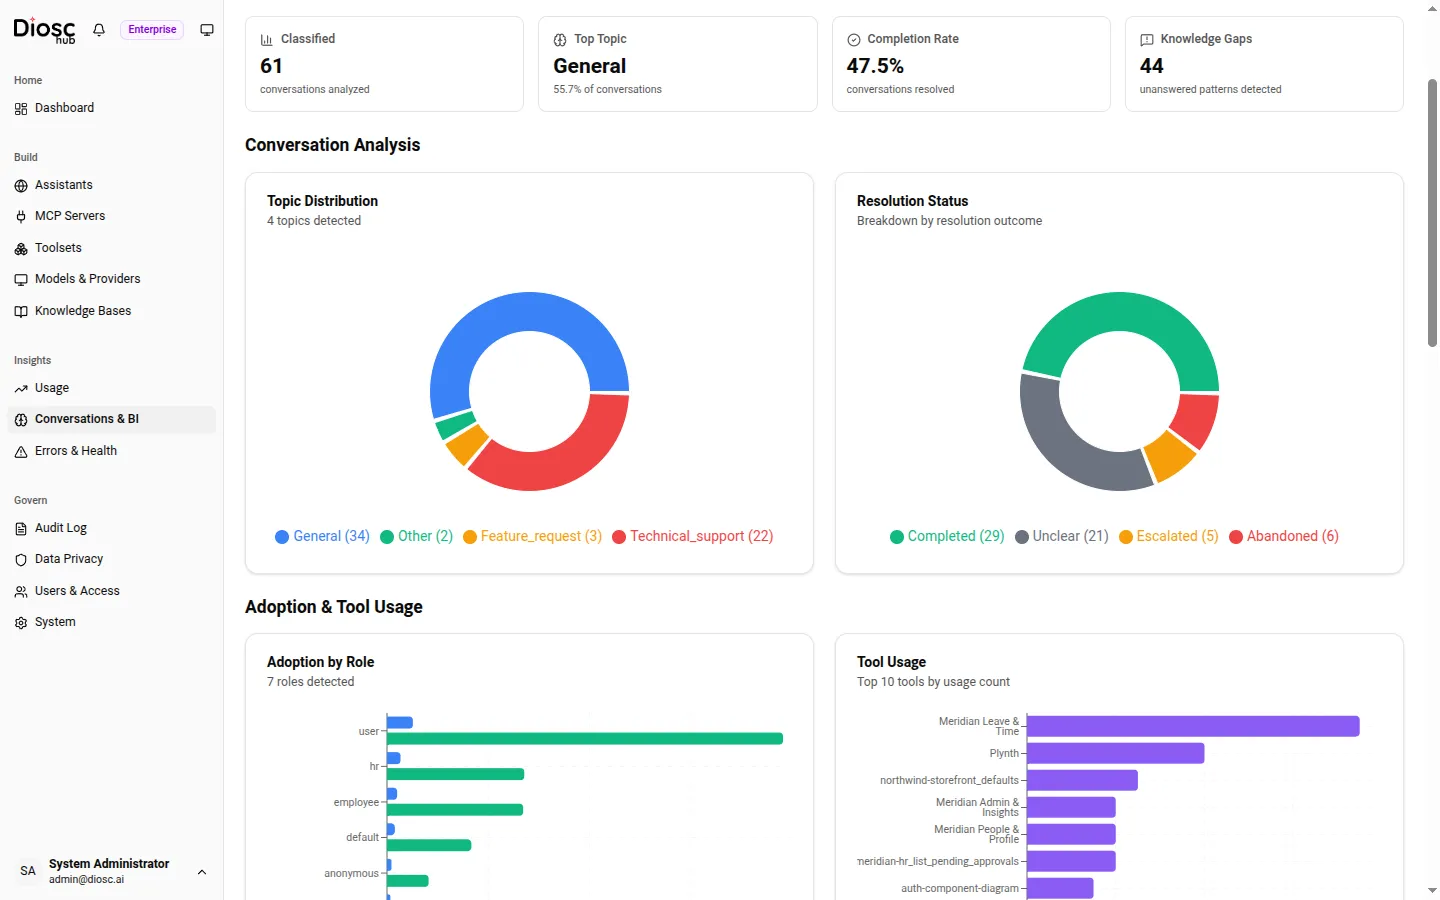 The Knowledge Gaps table: each row is a recurring unanswered pattern; the per-row menu moves it through
acknowledged, addressed, or dismissed.
The Knowledge Gaps table: each row is a recurring unanswered pattern; the per-row menu moves it through
acknowledged, addressed, or dismissed.
Performance
Section titled “Performance”The Performance section reads session statistics rather than classification output. Four tiles show average session duration, messages per session, returning users, and success rate, each with a trend against the previous period. Below them, a response-time chart and an error-rate chart plot those metrics across the window. These are the same session analytics surfaced on the admin dashboard.
The Taxonomy sub-page
Section titled “The Taxonomy sub-page”The topic taxonomy is the set of categories classification sorts conversations into, and it is defined per assistant. The Taxonomy button opens a page with an assistant selector and two cards.
Topic Taxonomy lists the defined categories in a table — each with a machine name, a display
name, its keywords, and how many conversations landed in it. Add Topic creates a category from a
display name, description, and keywords; the row menu edits or deletes an existing one. When an
assistant has no taxonomy yet, a Seed Defaults button appears and creates five starter categories:
General, Technical Support, Feature Request, Billing, and Other.
Discovered Topics lists topics the classifier found in conversations that are not yet in your taxonomy, each with its conversation count and an unmapped badge. Add one to the taxonomy with the plus button on its card, which pre-fills the add form from the discovered topic. This is how the taxonomy grows to match what users actually ask.
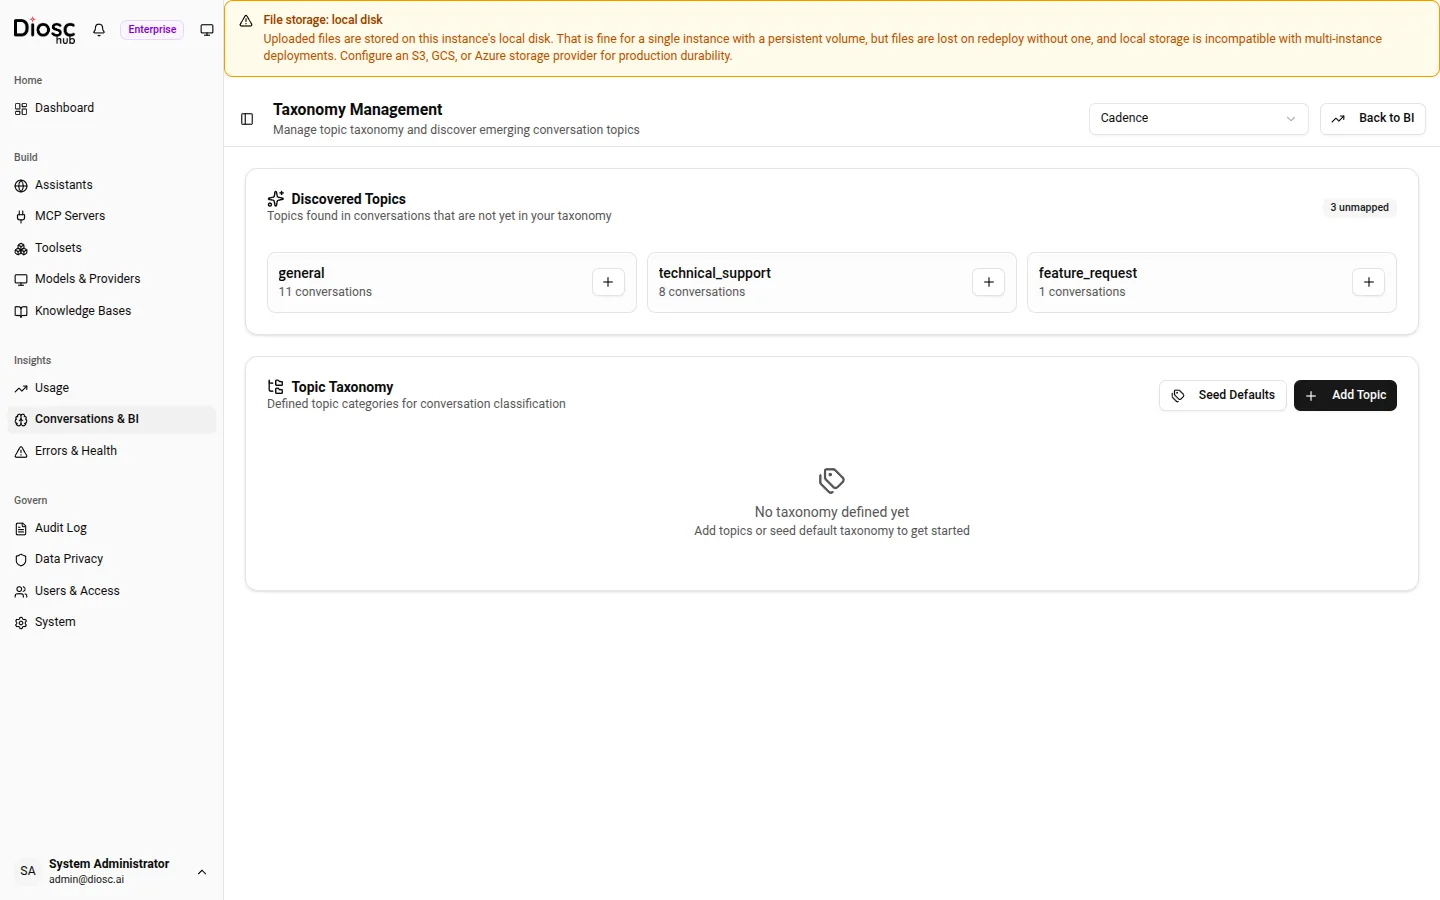 Taxonomy management: the Discovered Topics card surfaces emerging topics, and the Topic Taxonomy table
below is the category set classification sorts into.
Taxonomy management: the Discovered Topics card surfaces emerging topics, and the Topic Taxonomy table
below is the category set classification sorts into.
What BI reads, and the privacy boundary
Section titled “What BI reads, and the privacy boundary”Business Intelligence operates on conversation content — it reads stored sessions to classify them and to detect gaps. It respects the same data boundaries as the rest of the platform: auth credentials never enter the classification path, in line with BYOA, and the knowledge-gap surfaces are built to expose aggregate counts rather than the raw identities behind them. Because BI reads conversation content, it sits on the PII side of the platform’s privacy boundary — the same boundary that governs which surfaces may touch chat data.
Related
Section titled “Related”- Usage & cost — token consumption and budgets, measured separately from BI.
- Admin dashboard — the live session statistics the Performance section reuses.
- Knowledge bases — the knowledge a knowledge gap says was missing.
- Privacy boundary — the data-handling line BI operates within.
- Licensing & tiers — where the
businessIntelligencefeature is gated.