

MCP health & error logs
DioscHub tracks each registered MCP instance two ways: a health signal for whether DioscHub can reach the server and how many tools it discovered, and an error log that records every failed tool call with its category, timing, and payload. Both surface in the admin portal. This page covers reading them and the actions that reset a connection.
Health monitoring
Section titled “Health monitoring”Each MCP instance has a Health Check Interval (minutes) field on MCP Servers → (instance) → General, under the Health Monitoring card. DioscHub checks the server on that cadence; leave the field empty to disable periodic checks. The same card shows the instance’s current state:
- Current Status — a Connected or Disconnected badge for the client DioscHub holds to the server.
- Discovered tools — the count of tools DioscHub last fetched from the server.
- Tools last fetched — the timestamp of that fetch, or
Neverif it has not happened.
The MCP Servers list shows a live status badge per row that polls every 30 seconds. It reports Healthy with the round-trip latency in milliseconds, Unhealthy, Checking… while a probe is in flight, or Unknown when no check has run yet.
The General card orients you on a single server; the list badge is the at-a-glance view across all of them.
Test Connection and Reload
Section titled “Test Connection and Reload”Two row actions on the MCP Servers list act on the connection directly:
- Test Connection runs one probe now and reports the result —
Connection successful! Latency: <n>mswhen the server answers, or the failure reason when it does not. It does not change the held connection. - Reload closes the client DioscHub currently holds to the server and recreates it. Use it after the server’s URL, transport, or auth changes so DioscHub reconnects with the new configuration. Reload requires the
mcps:writepermission.
Reload re-establishes the connection; it does not re-read the tool catalog. To pick up added, renamed, or removed tools, open the instance’s Tools tab and use Refresh, which re-discovers the tools and updates the discovered-tool count and last-fetched time.
Error logs
Section titled “Error logs”Every failed MCP tool call is recorded. There are two views onto the same log:
- Per instance — the Errors tab of an MCP instance, scoped to that server.
- Deployment-wide — the Errors & Health page (
/mcp-error-logs), covering every instance and assistant, with five summary cards over the last 7 days: Total Errors (7d), Network Errors, Server Errors, Top MCP Instance, and Top Failing Tool.
Search and filters
Section titled “Search and filters”Both views share a full-text Search error messages box and a filter row. The per-instance Errors tab filters by Category, Tool, and a From/To date range. The deployment-wide page adds MCP (instance) and Assistant filters on top of those. Each filter’s dropdown lists the values that actually occur, with a count beside each. Clear filters resets the row.
The table
Section titled “The table”Results are paged, 20 rows at a time. Columns:
| Column | What it holds |
|---|---|
| Category | The error category (below), as a colored pill. |
| MCP Instance | The instance the call ran against. (Deployment-wide view only.) |
| Tool | The bare tool name that failed. |
| Error Message | The sanitized message, with the HTTP status appended when there is one. |
| Retries | How many retries DioscHub attempted before giving up. |
| Duration | Wall-clock time the call took before it failed. |
| Timestamp | When the failure was recorded. |
The eye icon on each row opens the detail modal.
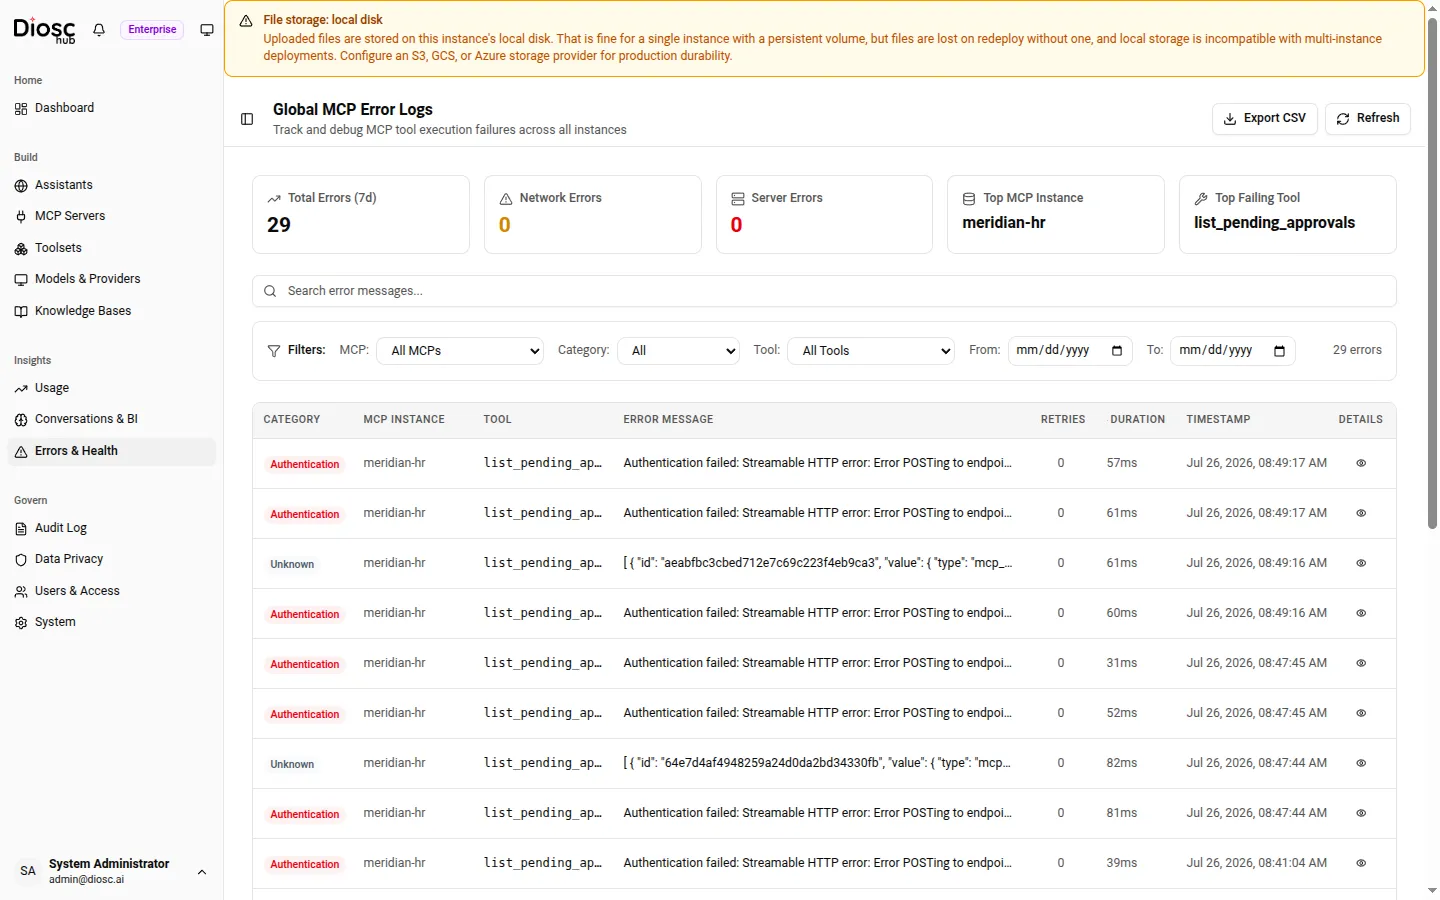
The table is where you scan volume and spot a pattern; the modal is where you take one failure apart.
The detail modal
Section titled “The detail modal”The Error Details modal expands one row. It shows the tool name, MCP instance, server name, duration, timestamp, retries attempted, whether the error was retryable, and the status code. Below that:
- Error Message — the full message, with a Copy button.
- Session & Context — the session ID, assistant ID, and server ID, copyable as one JSON block.
- Metadata — the recorded metadata for the failure, copyable.
- Tool Parameters (Sanitized) — the arguments the tool was called with, shown only when present, copyable.
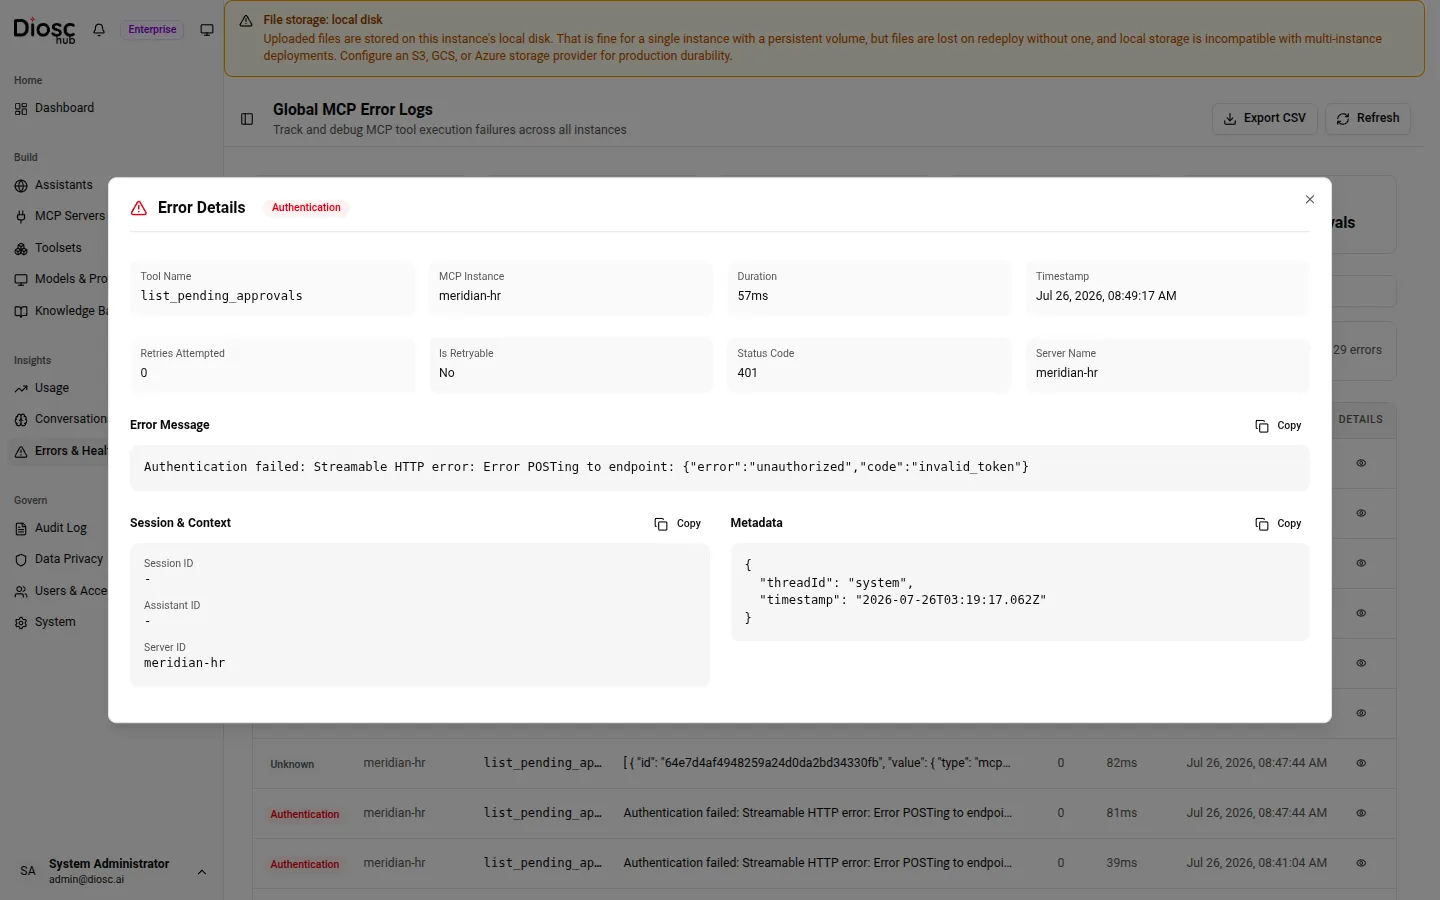
Tool parameters are sanitized before they are stored — auth artifacts never reach this log, the same way BYOA keeps them out of the model’s context.
Both views have an Export CSV action that downloads the currently loaded page of rows, and a Refresh action that re-runs the query.
What the categories mean
Section titled “What the categories mean”The Category pill classifies each failure so you can tell a network blip from a permission problem:
| Category | What it means operationally |
|---|---|
| Network | DioscHub could not reach the server — DNS, TLS, connection refused, or timeout. Check the URL and that the server is up. |
| Authentication | The server answered 401 or 403. The forwarded BYOA credential was missing, invalid, or not authorized for that tool. |
| Client Error | A 4xx other than auth — usually bad tool arguments or a request the server rejected. |
| Server Error | A 5xx from the MCP server. The tool ran and the server itself failed. |
| Circuit Open | The circuit breaker for that server has tripped after repeated failures, so DioscHub is short-circuiting calls instead of retrying a server it believes is down. |
| Unknown | An error that did not match the classes above. |
A run of Authentication errors on one tool points at the forwarded credential or the tool’s authorization, not at DioscHub. A Circuit Open streak means an earlier failure mode already tripped the breaker — look at the errors that preceded it. Retries and durations in the table tell you whether DioscHub kept trying or gave up immediately.
Where this connects
Section titled “Where this connects”- Register and attach servers, and organize their tools, in MCP servers & Toolsets.
- How the credential that an Authentication error is about reaches the server: MCP auth forwarding.
- Deployment-wide telemetry — Prometheus metrics (including
diosc_mcp_circuit_breaker_trips_totalanddiosc_mcp_auth_errors_total), logs, and health probes: Observability. - Which tier unlocks this surface: Licensing & tiers.