

Usage
The Usage page reports how many tokens your deployment has consumed and which models spent them.
It is a reporting surface, not an enforcement one — it tells you what happened, it does not cap
anything. The base view needs analytics:read, which every tier has; the charts and per-model
breakdown are a Pro capability, marked below.
All figures are counted in tokens. DioscHub does not price model usage in currency; there are no dollar amounts anywhere on this page.
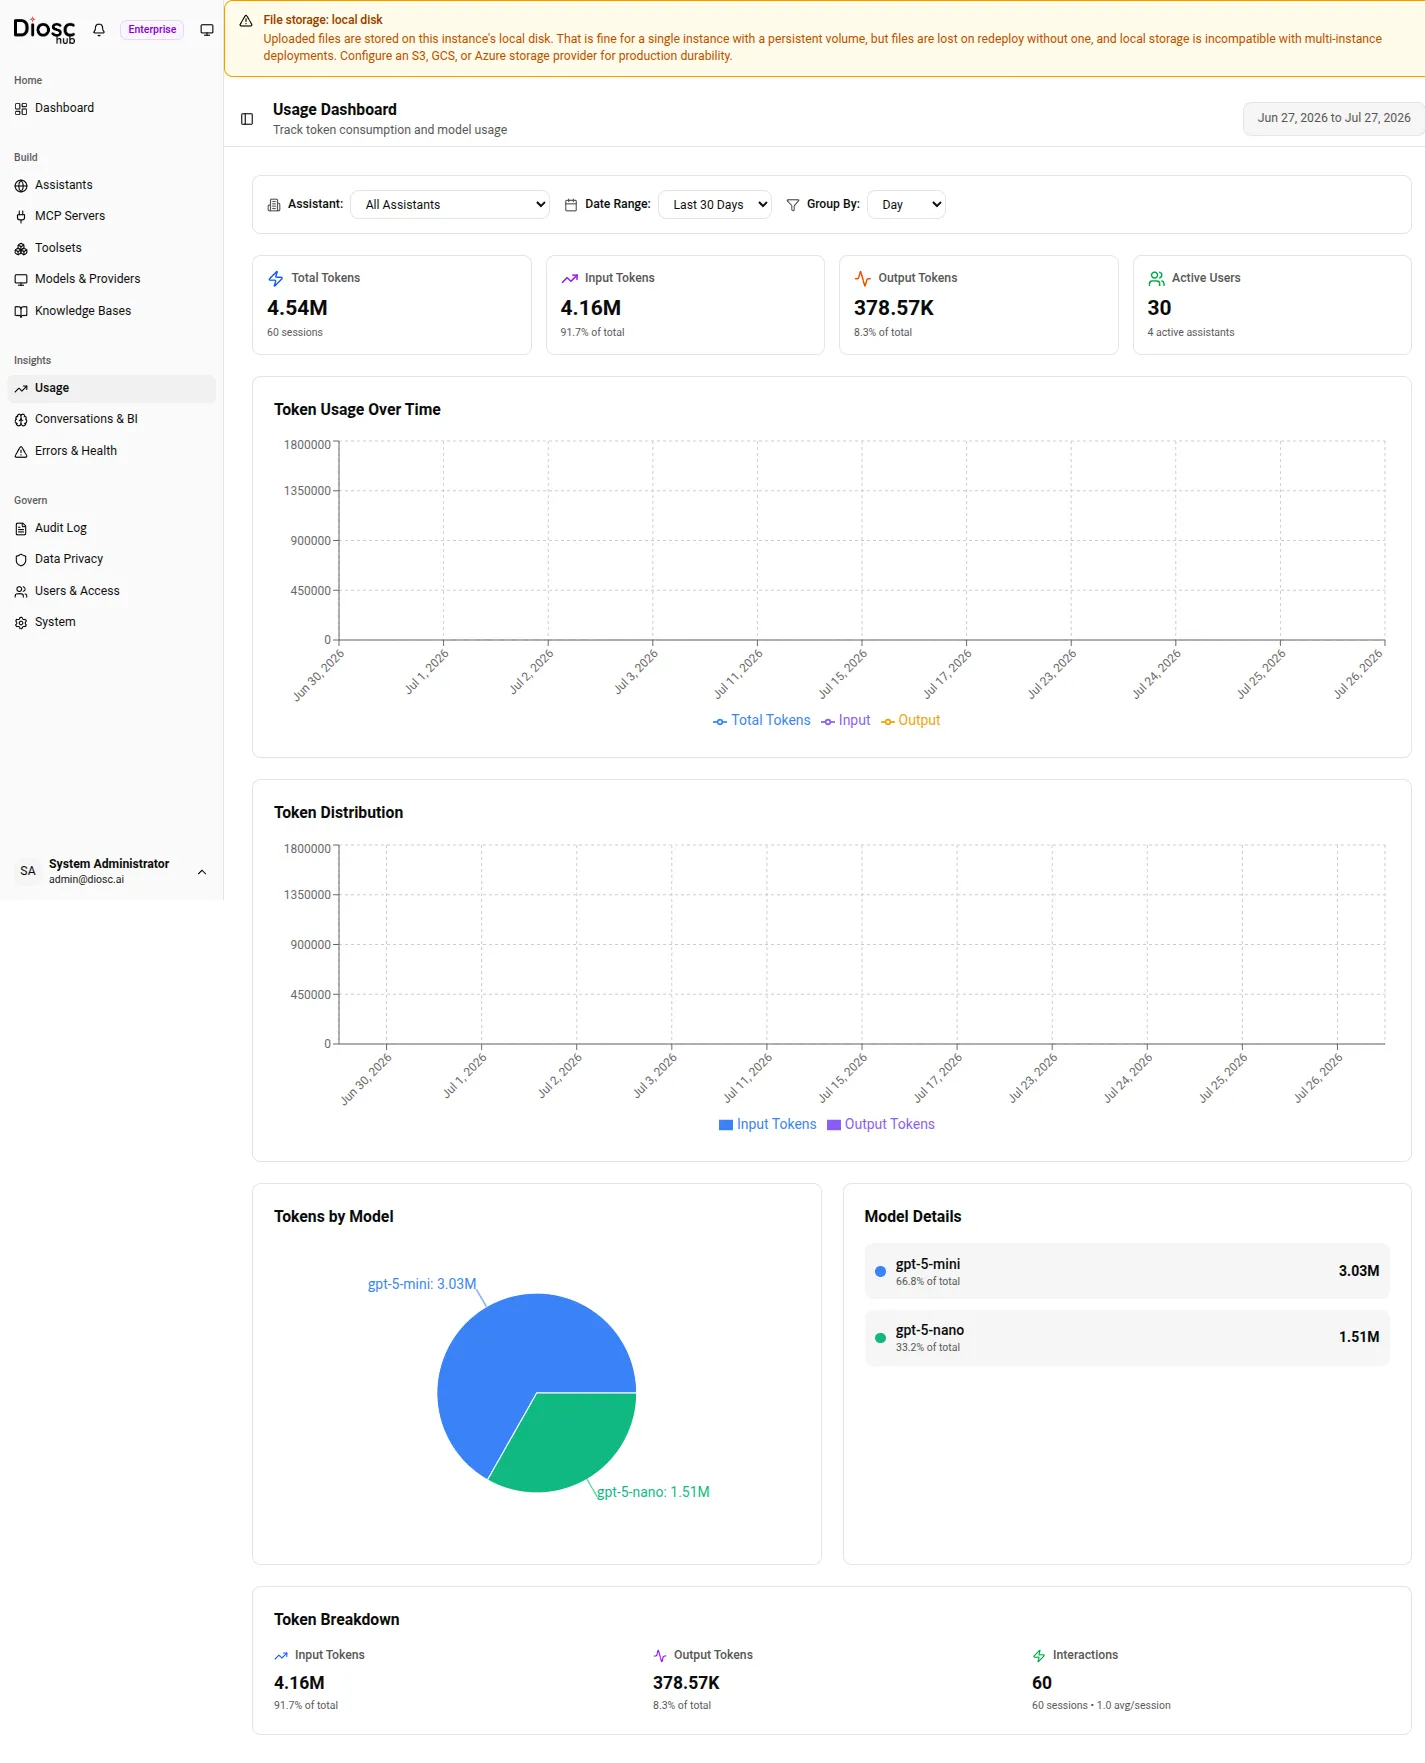
The Usage page on a deployment with real traffic: overview cards on top, the token-over-time trend, and the per-model breakdown below.
Filters
Section titled “Filters”Three controls at the top of the page scope everything below them. Changing any of them re-fetches the report.
| Filter | Options |
|---|---|
| Assistant | All Assistants, or a single Assistant by name. |
| Date Range | Today, Yesterday, Last 7 Days, Last 30 Days (default), This Month, Last Month. |
| Group By | Day, Week, or Month — the bucket size for the time-series charts. |
The header shows the resolved date range (for example, “Jul 1, 2026 to Jul 31, 2026”) so you can see exactly what window the numbers cover.
Overview cards
Section titled “Overview cards”Four cards summarise the selected window:
- Total Tokens — every token spent in the window, with the session count beneath it.
- Input Tokens — tokens sent to the model, with their share of the total.
- Output Tokens — tokens generated by the model, with their share of the total.
- Active Users — distinct users who drove traffic, with the count of active assistants beneath.
Detailed usage reporting Pro
Section titled “Detailed usage reporting ”The charts and per-model breakdown require a Pro or Enterprise license (detailedUsageReporting).
See Licensing & tiers.
Token Usage Over Time is a line chart of total tokens per bucket, with input and output drawn as dashed lines beneath the total. Token Distribution stacks the same input and output tokens as bars per bucket, so you can read the split at a glance.
The model breakdown answers which models spent the tokens. Tokens by Model is a pie chart, sliced per model. Beside it, Model Details lists each model with its token total and its percentage of the whole — useful when a single expensive model dominates the bill.
The Token Breakdown card at the bottom restates input tokens, output tokens, and interactions side by side, with the average interactions per session — a quick read on how much work each conversation costs.
Reporting, not enforcement
Section titled “Reporting, not enforcement”This page measures consumption after the fact. It does not limit anyone. Capping how many tokens an individual can spend is done with token budgets, which are configured and enforced on the Rate limiting & cost controls page — budgets resolve per Role, per Assistant, or from a platform default, and block the next turn when the cap is hit. Use Usage to see where the tokens went; use rate limiting to bound where they go next.
For the qualitative side of the same traffic — what users asked, and where the assistant fell short — see Conversation intelligence.