Usage
Monitor token usage across your Diosc deployment.
Usage Dashboard
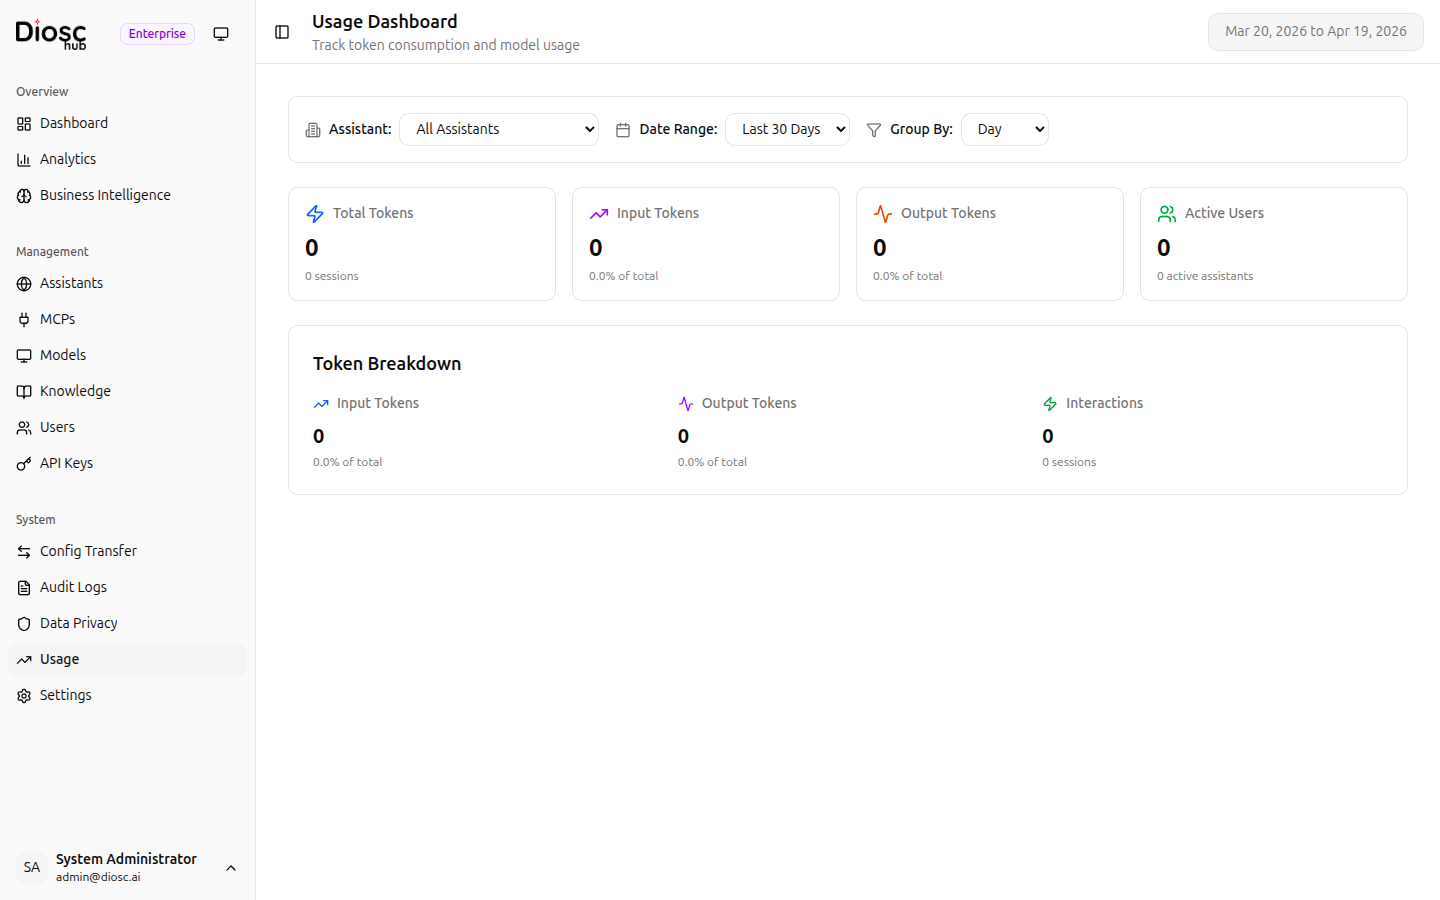
Navigate to Usage in the sidebar to open the usage dashboard.
Overview Metrics
The top of the page shows four key metric cards:
| Metric | Description |
|---|---|
| Total Tokens | Total tokens consumed in the selected period |
| Input Tokens | Total input tokens consumed |
| Output Tokens | Total output tokens generated |
| Active Users | Number of active users in the selected period |
Token Breakdown
The main view shows a breakdown of token consumption:
| Metric | Description |
|---|---|
| Input Tokens | Tokens sent to models as input |
| Output Tokens | Tokens generated by models |
| Interactions | Number of LLM calls |
Filtering
Use the filters at the top of the page to narrow the data:
| Filter | Description |
|---|---|
| Assistant | Select a specific assistant or all assistants |
| Date Range | Choose a time period for the data |
| Group By | Group results by different dimensions |
Best Practices
Monitor Regularly
- Check the dashboard periodically to spot unusual patterns
- Compare usage across assistants to identify optimization opportunities
- Watch for usage spikes that may indicate issues
Optimize Token Usage
- Use Budget-tier models for simple, high-volume tasks
- Use Premium models only where complex reasoning is needed
- Review token breakdown to understand input vs. output distribution
Track Per-Assistant
- Use the assistant filter to compare usage between assistants
- Identify which assistants consume the most tokens
- Adjust model selection per assistant based on complexity needs
Next Steps
- Global Settings — Configure rate limits and system settings
- Monitoring — Audit logs and system health