Dashboard
The Dashboard provides an at-a-glance overview of your Diosc deployment.
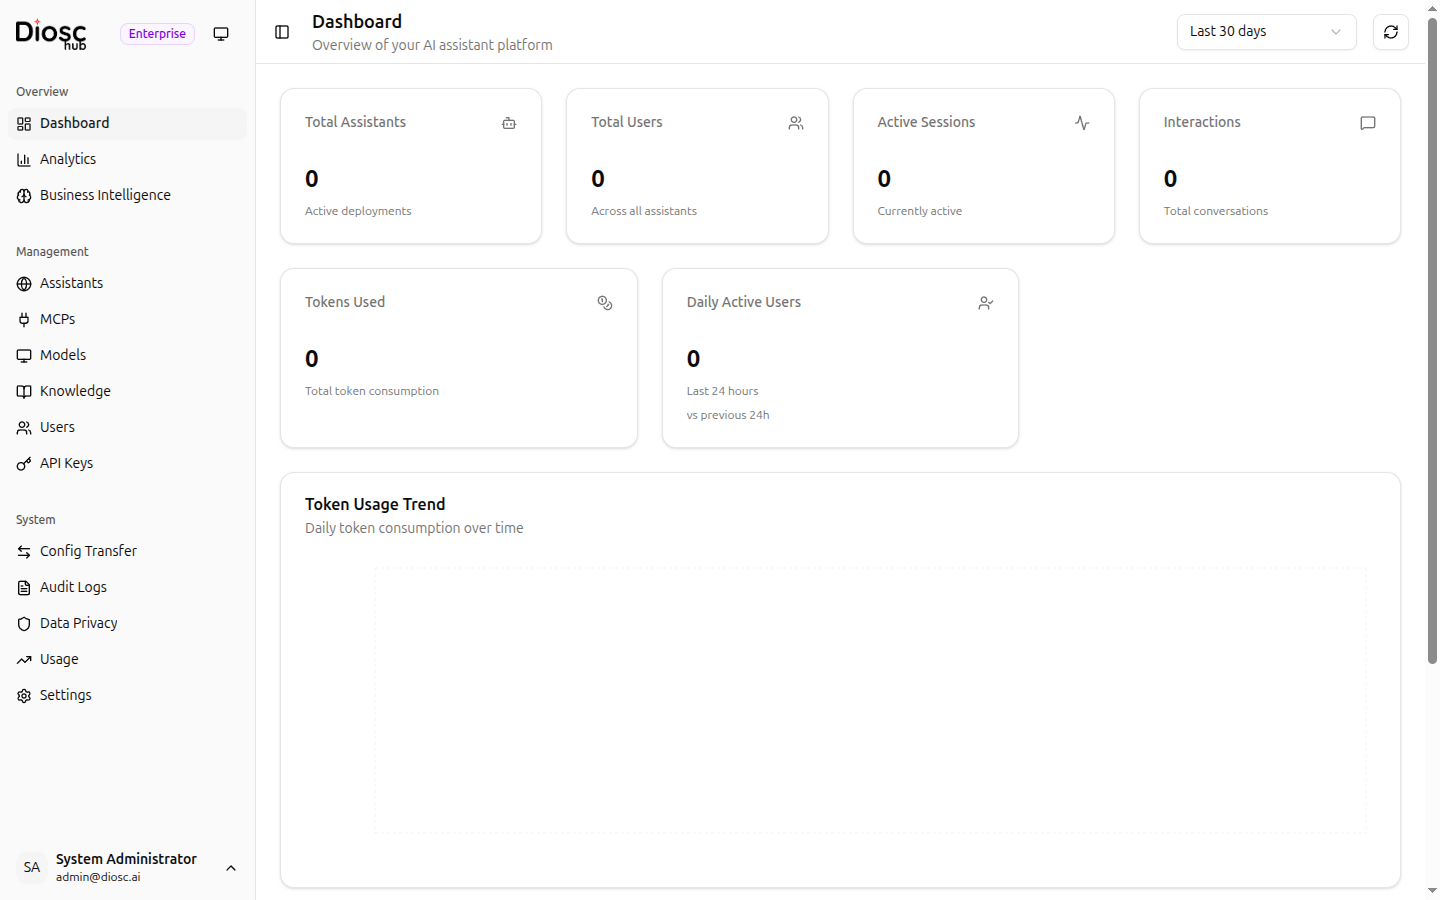
Key Metrics
Six metric cards are displayed at the top:
| Metric | Description |
|---|---|
| Total Assistants | Number of active assistant deployments |
| Total Users | Number of users across all assistants |
| Active Sessions | Currently active chat sessions |
| Interactions | Total conversations in the selected period |
| Tokens Used | Total token consumption |
| Daily Active Users | Unique users in the last 24 hours |
Token Usage Trend
A daily line chart showing token consumption over time. Use the Date Range Picker in the top-right corner to adjust the time window.
Top Assistants by Usage
A table ranking your most active assistants by token consumption. Use this to identify which assistants are driving the most engagement.
Next Steps
- Analytics — Deep-dive into usage analytics
- Business Intelligence — Topic analysis and knowledge gaps
- Usage — Detailed token usage monitoring