Analytics
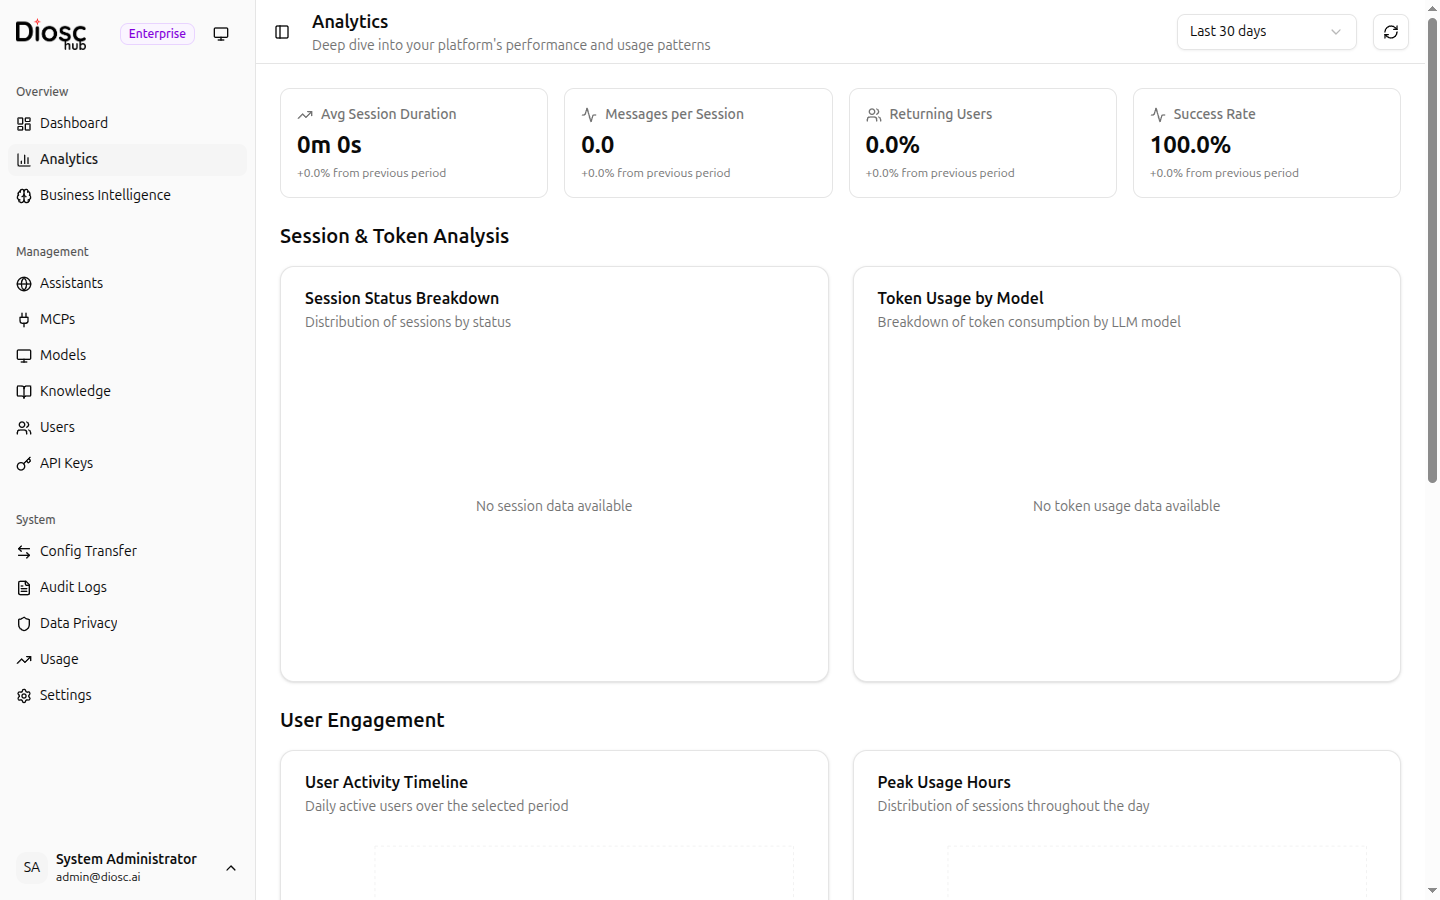
The Analytics page provides deep-dive charts and metrics for understanding user engagement and performance trends.
Overview Stats
Four summary cards at the top show key metrics with trend indicators (compared to the previous period):
| Metric | Description |
|---|---|
| Avg Session Duration | Average length of chat sessions |
| Messages per Session | Average number of messages exchanged per session |
| Returning Users % | Percentage of users who return for multiple sessions |
| Success Rate % | Percentage of sessions that completed successfully |
Charts
Session & Token Analysis
- Session Status Breakdown — Breakdown of sessions by status (active, completed, errored, etc.)
- Token Usage by Model — How token consumption is distributed across different LLM models
User Engagement
- User Activity Timeline — Timeline showing unique users per day over the selected period
- Peak Usage Hours — Chart showing which hours of the day see the most activity
Performance Metrics
- Response Time — Average response latency over time
- Error Rate — Percentage of errored requests over time
Date Range
Use the date range picker at the top of the page to adjust the analysis window. The default is the last 30 days. Click Refresh to reload data manually.
Next Steps
- Dashboard — High-level deployment overview
- Business Intelligence — Topic analysis and knowledge gaps
- Usage — Detailed token usage monitoring